New Zealand's water quality is good by international standards - and declining. Long-term national monitoring shows significant rising trends in nitrogen and phosphorus, and diffuse pollution from agricultural land use is the main cause: dissolved nitrogen (much of it from animal urine), phosphorus (largely from fertiliser), faecal microbes and sediment. Pastoral farming occupies about 40% of New Zealand's land area, so what happens on farms decides what happens to the wai.
Sheep and beef numbers have actually fallen from their peaks, but the water-quality gains were outweighed by dairy growth. Dairy herds behave differently - twice-daily walks to the shed, sometimes crossing streams - and dairying concentrates on flat, often irrigated, intensively fertilised land close to waterways and groundwater recharge zones. The most intensive farming is happening exactly where water is most vulnerable.
In many groundwater systems it takes decades for rain falling today to emerge in springs and streams. Today's monitoring results partly reflect farming practice from the 1960s and 70s - and the full effect of today's land use may not show in spring-fed streams, lakes and wetlands for another 30–40 years. What we do now is a gift (or a debt) to the next generation.
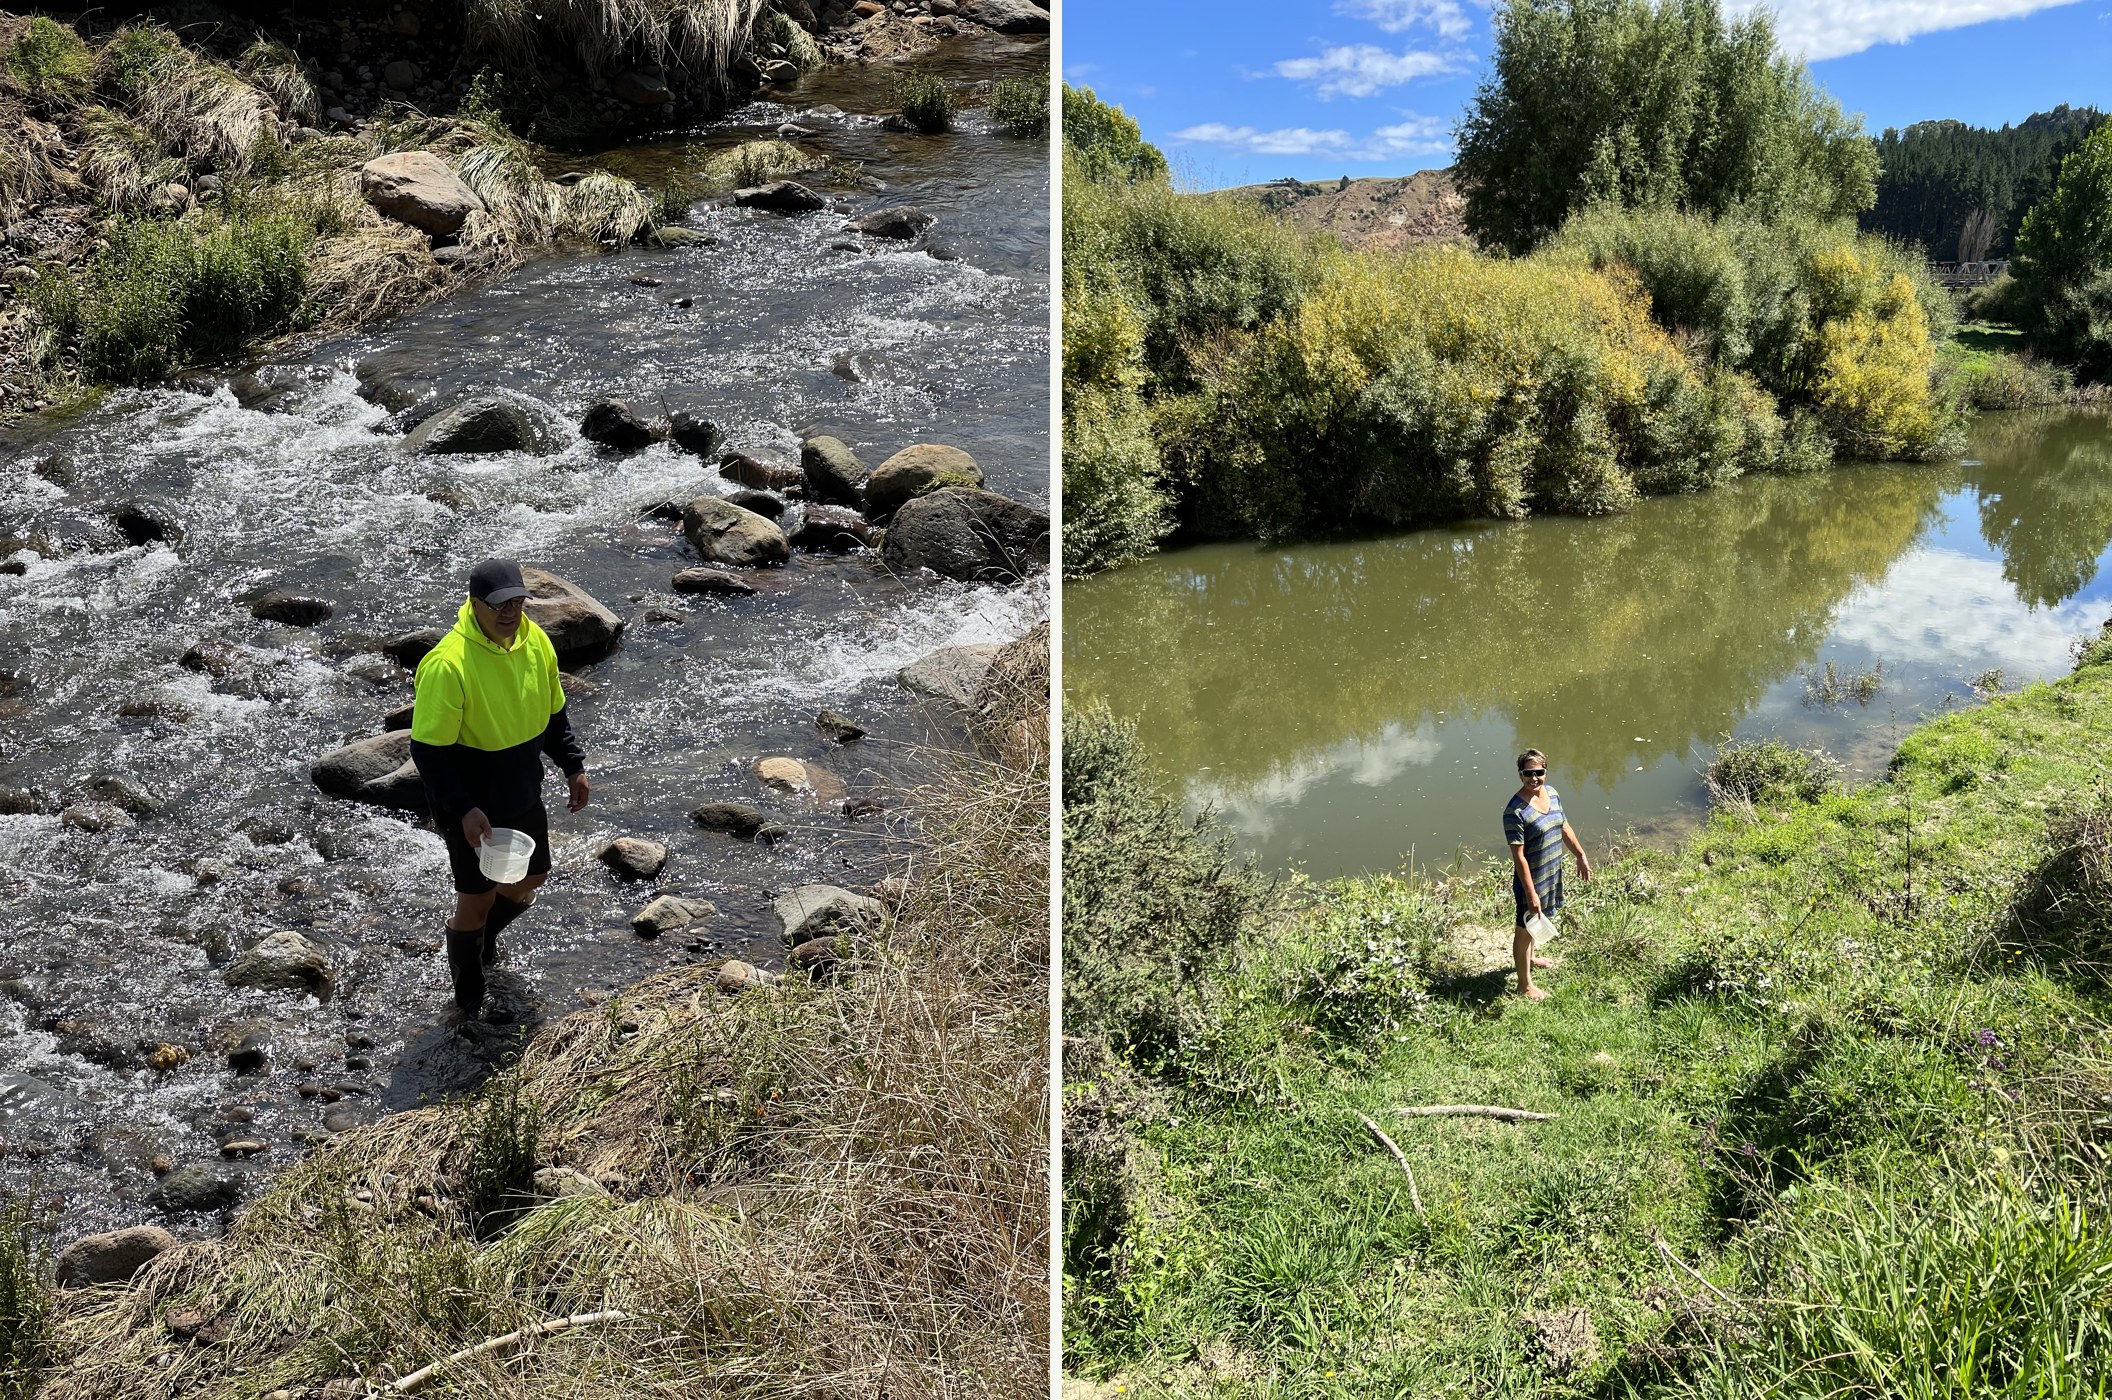
Farm surface water testing shows how your management is affecting stream health - and, if stock drink from streams, it matters for their health too. The trick is to test at two points: where water enters your farm, and where it leaves. The entry point shows what the wider catchment is sending you (a neighbour's nitrates, for example); the exit point reflects your own management. The goal is simple: minimise the nutrients your land loses to the wai.
Sample at least twice a year - late winter and summer - during average flows, so results are comparable season to season. DIY water testing kits can be purchased from places like Hill Labs.
Turbidity measures how light scatters off fine particles in the water - effectively sediment load. Clarity naturally drops as flow rises, so judging real change needs flow-adjusted trends over time. Poor clarity harms stream ecosystems in many ways, from smothered habitat to blocked light.
Measured 0–14 with 7 neutral. Acidification (for example from sulphur dioxide and nitrogen oxides) damages aquatic life.
Pure water barely conducts electricity; dissolved salts and solids raise conductivity. It's a quick proxy for how much material is dissolved in your water.
The sum of all nitrogen forms in the sample. Elevated nitrogen drives the excess plant and algal growth that degrades waterways.
Usually present at low levels compared with nitrate and ammonia - but too much is toxic, and in drinking water it's harmful to both people and stock.
A vital plant nutrient that leaches through soil into groundwater with ease, especially after heavy rain. On farms the main sources are nitrogen fertiliser and animal waste. High levels threaten human and stock health, fuel algal growth, and can be toxic to fish and invertebrates.
The sum of organic nitrogen, ammonia and ammonium. High TKN can indicate sewage or manure discharges reaching the water.
Total phosphorus indicates phosphate entering the water largely through sediment erosion. Over time, sediment-bound phosphorus dissolves and becomes available to plants - measured as Dissolved Reactive Phosphate (DRP). Very high DRP drives rapid weed growth and algal blooms that do long-term damage.
E. coli lives in the guts of warm-blooded animals and birds. Finding it means faecal matter has reached the water - and other disease-causing organisms may have come with it.
The insects, snails, shrimps and worms living in a stream are a running record of its health. The Macroinvertebrate Community Index (MCI) scores each type of invertebrate by its tolerance of organic pollution, from 1 (very tolerant) to 10 (very sensitive), then multiplies the average by 20. Sensitive creatures like mayflies can only live in healthy water - so who's living in your stream tells you what your water has been like, not just what it's like today.
A net is held downstream while stones on the streambed are turned over, washing the creatures into the net. The catch is sorted - on site or in the lab - and a person with taxonomic skills records each type present. The MCI only needs the types, not a count of every individual.
Studies show MCI tracks organic and nutrient enrichment well. It's not perfect - floods can scour out invertebrates, and shade affects how streams respond to nutrients - but these influences are built into the sampling protocols and considered when interpreting results. A high MCI doesn't automatically mean safe swimming, though: invertebrates don't respond to the pathogens that make swimmers ill, so use E. coli results for that.
Invertebrates convert the stream's energy inputs - fallen leaves, algae, and dissolved carbon washed from soils - into food for whitebait, tuna, trout and birds. Along the way they keep the streambed clean and recycle nutrients. Lose the bugs and the whole food web above them goes hungry.